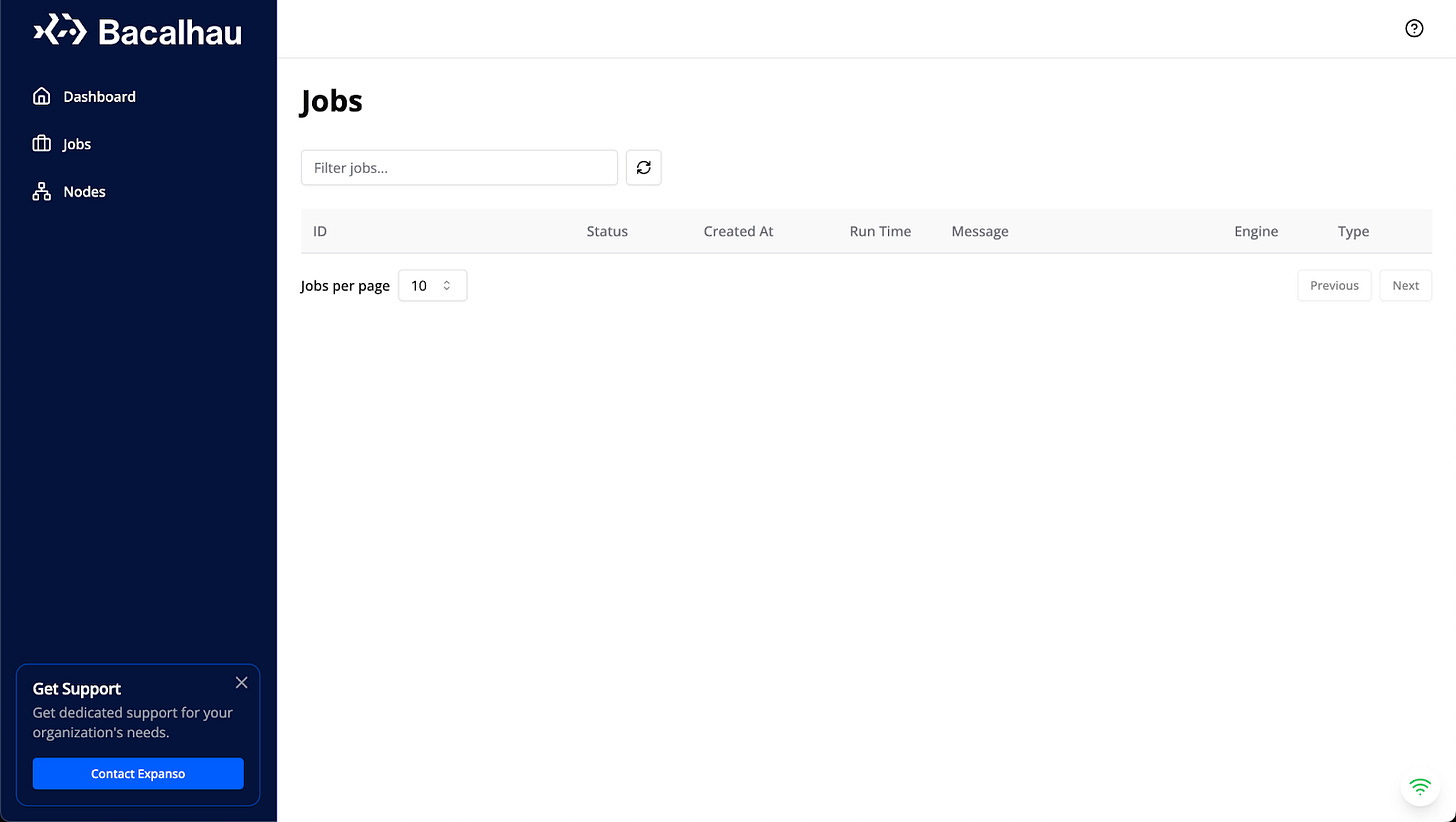
Hey there, distributed compute enthusiasts! While the CLI is near and dear to our hearts, sometimes you want a visual overview of what’s going on with your cluster. We’re happy to announce Bacalhau’s NEW embedded web UI! We've cooked up a delicious interface that's easy to navigate, let's dive in and explore what's on the menu.
Setting the Table: Getting Started
Before we get started, you’ll need to use the latest version of Bacalhau. To do so, install it here:
curl -slL https://link.cod.dev/NewWebUI | bash
It should automatically take you through all the steps to install Bacalhau, and get you started. Then all you have to do is start a node! Execute the following command:
bacalhau serve --node-type=requester,compute --web-ui
This is a bit more than the default, because we are making this both a requester and a compute node and turning on the web UI (which is off by default).
Now, open your favorite browser and navigate to http://0.0.0.0:8483 (the default URL and port).
Welcome to your new command center!
The Main Course: Exploring the Dashboard
As soon as you land on the dashboard, you'll see a sea of information at your fingertips:
Dashboard: Overview of the entire cluster.
Jobs overview: A school of your recent jobs.
Nodes at a glance: Your compute nodes, with resource information, and architecture.
Casting the Net: Submitting a Job
Let's get our feet wet by submitting a job:
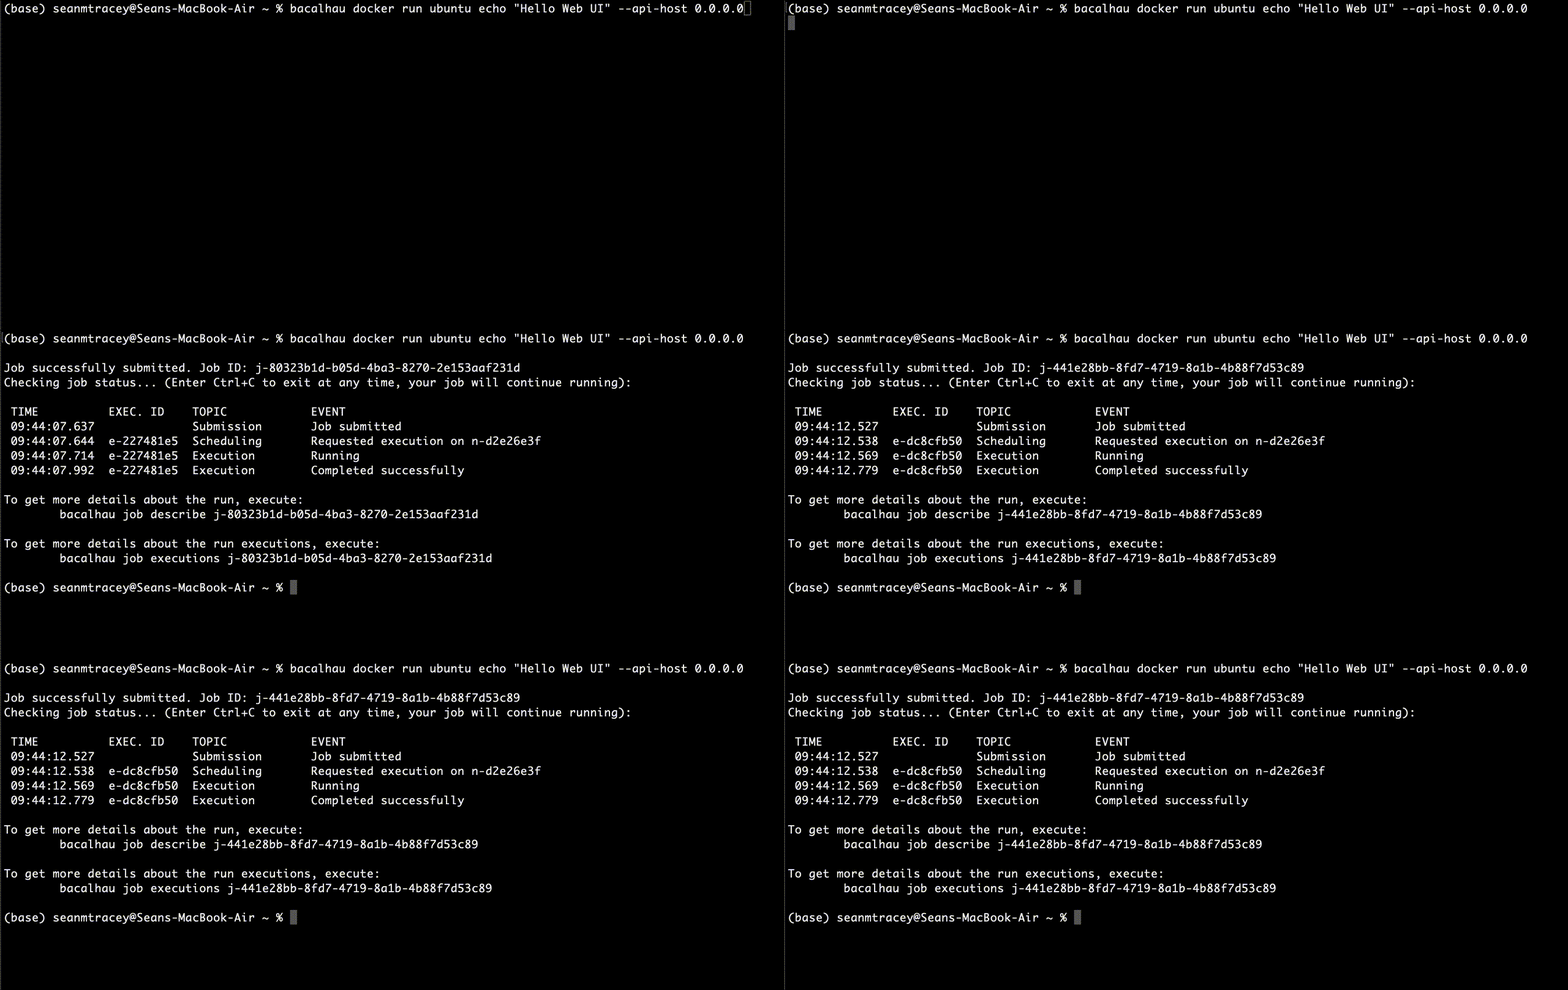
Go back to your command line. Type out a simple job.
bacalhau docker run ubuntu echo "Hello Web UI!" --api-host 0.0.0.0
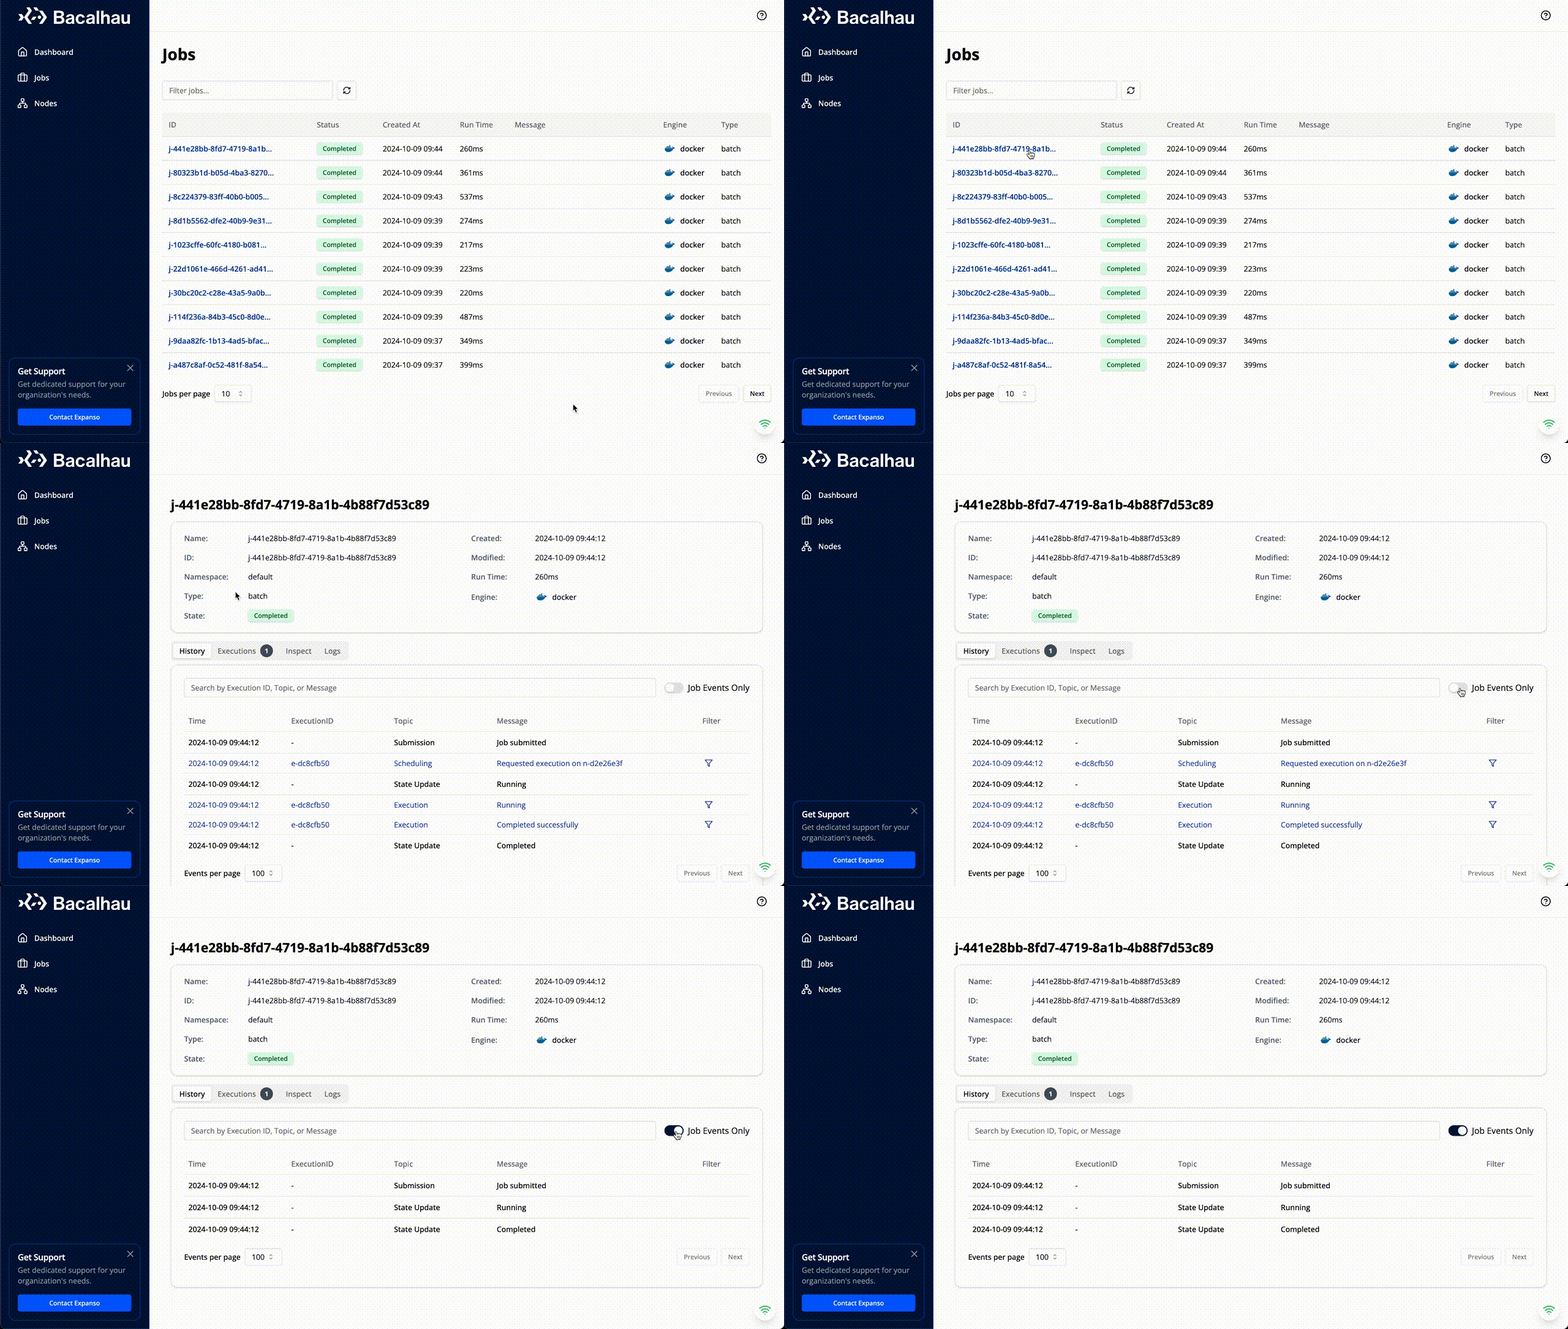
Once you submit, go over to the browser again, and hit refresh. You should see your job at the top of the list.
If you click on the ID of the job, you will be able to see helpful details about the execution. You can also filter down to just the events related to your job (instead of all the information about the node execution).
Additionally, if you click on “Inspect”, you’ll be able to see exactly what the spec of the job was.
And with our brand-new streaming logs API, you’ll be able to stream logs of jobs currently running.
Fish Finder: Monitoring Your Jobs
Navigate to the "Jobs" tab to see all your little job-fish swimming around:
Job status: See which jobs are still swimming (running), which have reached their destination (completed), and which may have encountered a shark (failed).
Job details: Click on any job to dive deeper. You'll see logs, output, and more.
Pro tip: Use the search bar to find specific jobs faster than a barracuda!
School of Nodes: Managing Your Compute Fleet
Swim over to the "Nodes" tab to see your compute armada:
Add a node: Expand your school with a new compute node:
bacalhau serve --node-type=compute --data-dir=/tmp/other_bacalhau
Node health: Each node shows its vitals - CPU, memory, and storage usage. It's like a fish health check.
Remove a node: If a node is feeling under the weather, you can remove it:
bacalhau node delete <NODE_ID>
Diving Deeper: Advanced Features
For the deep-sea explorers among you:
Custom filters: Create saved filters faster than a dolphin's echolocation.
Resource allocation: Distribute your compute power, like a wise old octopus.
API integration: For those who want to communicate with the fishes programmatically.
The Catch of the Day: New UI Highlights
Real-time updates: Watch your jobs and nodes update live, like a mesmerizing sea anemone.
Responsive design: Use it on any device - from a tiny crab's phone to a whale-sized monitor!
Wrapping Up: A Sea of Possibilities
With Bacalhau's new web UI, managing distributed computing has never been more accessible or more fun! Whether you're a guppy just starting out or a seasoned deep-sea diver of distributed systems, our new interface has something for everyone.
We can't wait to see what amazing things you'll compute in this vast ocean of data. So dive in, the water's fine, and there are plenty of compute-fish in the sea!
Happy computing, and remember—just keep swimming! 🐠💻🌊


