How to Save 95% on Log Processing with Bacalhau and MotherDuck
(10:15)
Many organizations spend a ton of time and money centralizing data in a data warehouse, only to discard most of it via an ETL process. Wouldn't it be easier to process data where it was created? Together, DuckDB and Bacalhau let you transform your data where it is being generated, dramatically reducing the amount of data you need to transfer and the amount of work you need to do in your data warehouse. Because Bacalhau enables data transformations at the point of creation, organizations get greater control, improved security, and reduced costs. By extending DuckDB to the cloud with MotherDuck, you also get the added benefits of centralized storage, multi-user concurrency, and organization-wide sharing.
This article will demonstrate how to implement this capability to achieve faster results at a more cost-effective price. Onward!
TOOLING OVERVIEW
DuckDB is an in-process analytical database. Thanks to its ability to run in-process in its host application or as a single binary, it is uniquely portable and embeddable, and can run anywhere, including directly in the web browser. It can read multiple files from S3, auto-detect the schema, and query data directly via HTTP. With over 2M monthly downloads, DuckDB has tapped into enormous industry demand for a lightweight, single-node, ultra-fast analytics database.
MotherDuck is an in-process SQL OLAP data warehouse that extends DuckDB to the cloud. Its dual-engine, rule-based optimizer can plan query operators so they execute close to where the data is located, either locally or in the cloud. If some data is local and some is remote, parts of the query will execute in both locations, using ‘bridge’ operators to unify the upload and download process between local storage and the cloud. MotherDuck also has a remote catalog that gives local DuckDB users access to MotherDuck databases in the cloud directly from within the CLI. In this way, developers can tap into lighting-fast, local machine processing and the global scale and reliability of the cloud simultaneously.
Bacalhau is Expanso’s open-source, distributed compute platform that spans regions, clouds, and on-premise environments. By running agents near your data and connecting them all together using your network, Bacalhau enables you to execute remote queries directly on your existing data. This method is quicker and more reliable than moving data to a central warehouse first. By transferring only important results instead of raw data, you can make faster decisions, cut data transfer costs, reduce the security risks of moving data, reduce regulatory concerns, and use latent edge compute capacity instead of expensive and limited data center compute. Let’s show you how all these pieces fit together!
Getting Information from Logs
Log files are a valuable source of information for IT professionals. They are present in every service, virtual machine, and device, and they generate a continuous stream of data. When harnessed effectively, log files can enable troubleshooting problems, identifying security threats, and tracking user activity. They may contain a variety of information, including service health, user sessions, and application-specific details.
However, retrieving log files can present several challenges. Log files can be very large, often terabytes in size for a single service, and they accumulate continuously. Additionally, they often need substantial pre-processing and transformation to become usable. Finally, log files can be stored in various locations, which can make it difficult to find and access them.
There are a number of solutions available to enhance security, expedite transport, and refine the information contained in log files. Utilizing a log management tool is one approach, facilitating the collection, storage, and analysis of log files. Alternatively, deploying a log analytics tool can assist in identifying security threats, troubleshooting issues, and monitoring user activity.
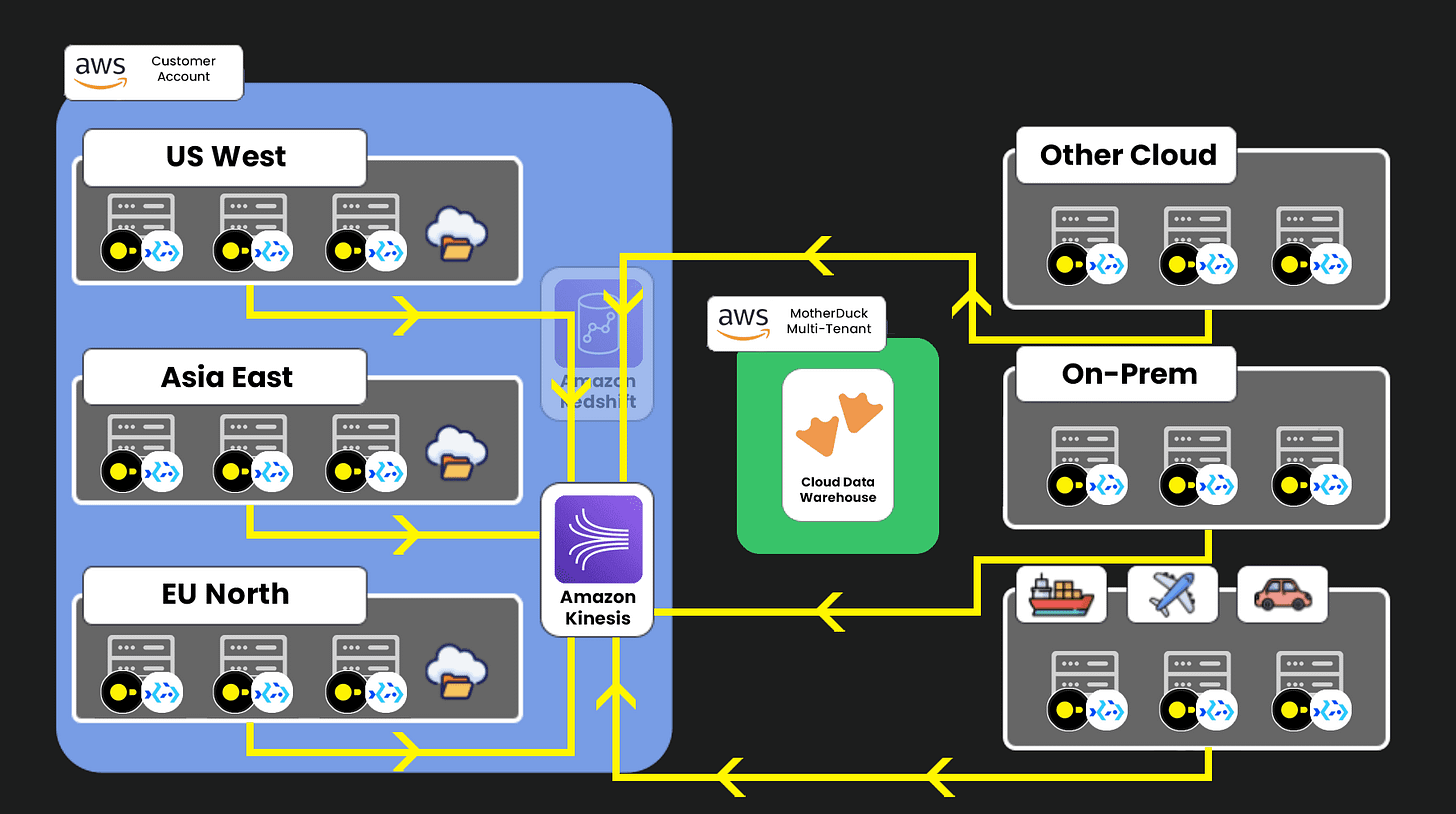
Many log analysis tools require moving log data to a central repository for analysis, which may involve steps like compression, encryption, transport, and ingestion. Thanks to its portability, DuckDB allows some of this processing to occur at the point of log creation. Because the DuckDB binary is relatively compact, it can be compiled and run anywhere, including within the web browser. By using MotherDuck to manage query planning, your processed log data can be stored and persisted in the cloud with a single command. Thanks to MotherDuck’s differential storage capabilities, changed data is stored independently as a mutation tree, which enables zero-copy duplication, sharing, and querying to deliver a uniquely collaborative data warehousing experience. However, the challenge remains in distributing queries, whether ad hoc or scheduled, to these machines. Bacalhau, a distributed compute platform, directly meets this need by dispatching your queries to the relevant machines. Let’s take a look at a potential system setup and its structure:
Shifting the compute to where data originates allows organizations to notably enhance the speed of obtaining insights, the security of results, and the reduction of costs associated with processing and storage. Let’s pull back the covers and take a closer look!
The “standard” ETL Pipeline
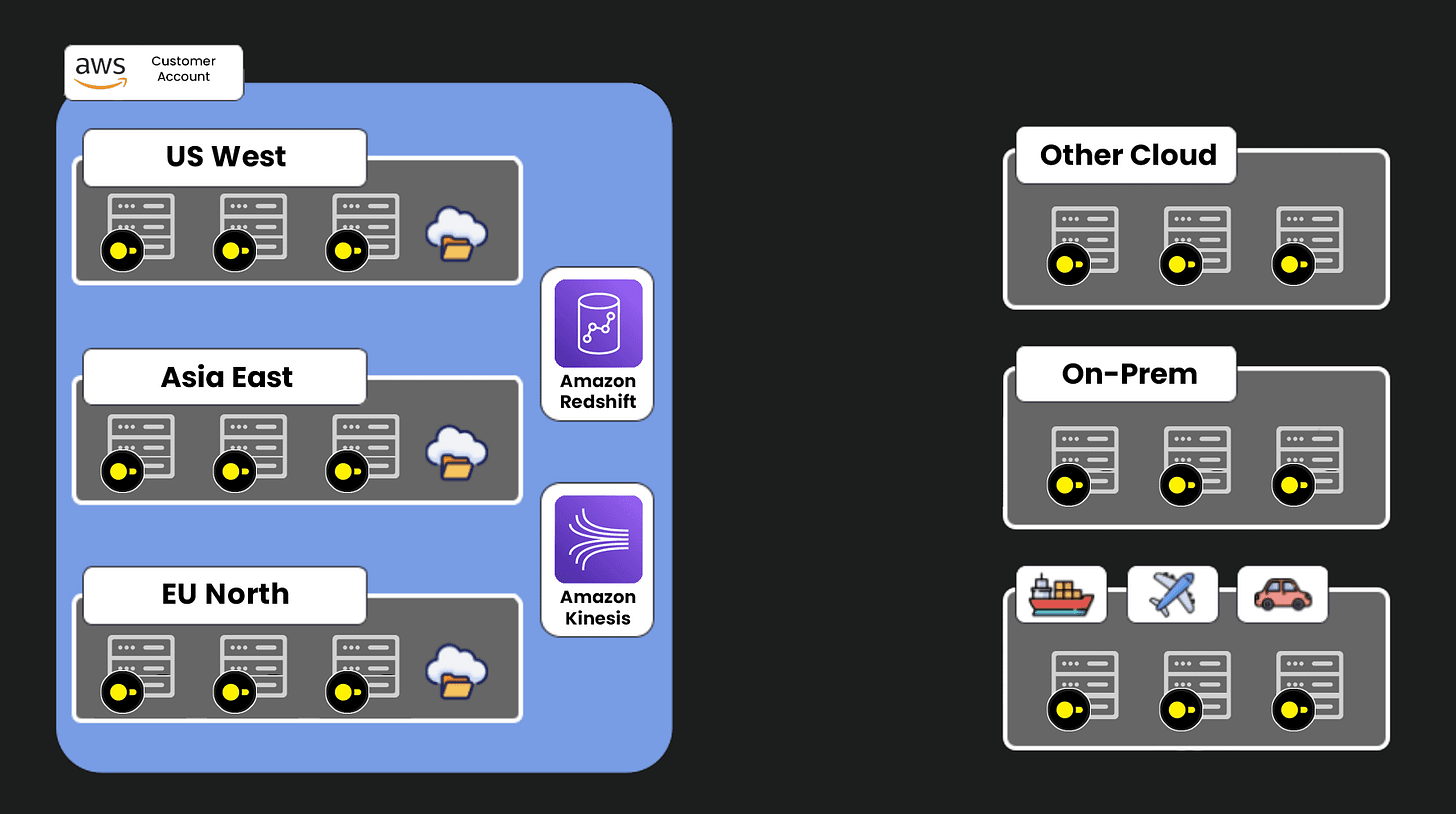
For our example, we will be talking about a very common architecture - a distributed set of virtual machines across regions and across clouds. It may look a bit like this:
In this setup, we've distributed our machines strategically—across different regions to ensure reliability, near users for better performance, and within various cloud environments to comply with data regulations. Each machine generates logs, providing valuable data that our organization analyzes to make informed decisions. Here's what they might look like:
55.166.192.39 - christinakim [2024-01-2919:01:09.774077-05:00] GET /search/tag/list HTTP/1.1 200 4951
178.142.230.199 - mary49 [2024-01-2919:01:12.628377-05:00] GET /login HTTP/1.1 200 44682
95.187.151.185 - parra [2024-01-29T19:01:13.237689-05:00] GET /apps/cart.jsp?appID=9182 HTTP/1.1 200 4978
31.52.124.51 - karen79 [2024-01-29T19:01:14.456815-05:00] GET /search/tag/list HTTP/1.1 200 5003
94.209.82.75 - anthonyrobert [2024-01-2919:01:17. 093817-05:00] GET /explore HTTP/1.1 301 5110
153.93.195.121 - gabrielraymond [2024-01-29T19:01:18. 302267-05:00] GET /login HTTP/1.1 200 85511
47.235.48.10 - jack59 [2024-01-29T19:01:20.310266-05:00] GET /wp-content HTTP/1.1 200 4922
80.216.236.243 - jamie34 [2024-01-2919:01:25. 057705-05:00] GET /wp-content HTTP/1.1 500 4945
143.134.186.221 - maldodomelissa [2024-01-2919:01:25.570549-05:00] GET /app/main/posts HTTP/1.1 200 5030
12.70.66.44 - jamesdan [2024-01-2919:01:25.723001-05:00] GET /apps/cart.jsp?appID=6383 HTTP/1.1 200 5019
122.206.201.74 - masonlauren [2024-01-29T19:01:29.582093-05:00] GET /logout HTTP/1.1 200 36016
201.80.14.219 - camposmegan [2024-01-29T19:01:30.611649-05:00] GET /login HTTP/1.1 301 17001
94.209.82.75 - anthonyrobert [2024-01-2919:01:33. 093817-05:00] GET /logout HTTP/1.1 500 61851
179.76.136.199 - watso [2024-01-29T19:01:34.973751-05:00] GET /apps/cart.jsp?appID=8060 HTTP/1.1 200 5070
54.233.98.189 - jeff95 [2024-01-29T19:01:36.042023-05:00]
GET /apps/cart.jsp?appID=2714 HTTP/1.1 200 5027
15.238.79.120 - urussell [2024-01-2919:01:37.387766-05:00] GET /login HTTP/1.1 200 78139
55.166.192.39 - chriskim [2024-01-29T19:01:37.774077-05:00] GET /posts/posts/explore HTTP/1.1 200 4981
These contain everything from standard sessions and redirects to system errors and detailed user interactions. Even a modest deployment like the one above can churn out gigabytes, or even terabytes, of log data daily. Transferring, ingesting, and extracting insights from this volume of data can be extremely expensive and time-consuming. The truth is, much of this data isn't immediately useful. To unlock its value, we need to process, filter, and aggregate it. What's the best approach for a developer who’s facing this challenge?
Filtering your ETL Pipeline
Data pipelines typically don’t start with “Extract.” A preliminary filter phase is usually in play before the data is ever moved. The filtering may include:
Alerting on critical events
Aggregation of results
Sanitization or anonymization
Removal of known attacks
Geographic isolation
Compression and chunking
Traditionally, processing log data is handled by multiple machines within an organization's core infrastructure or through hosted solutions like Splunk or Datadog. Given the sheer volume of data, transferring and processing it can take a significant amount of time. However, transformation is essential because the raw data is both a security risk and cluttered with irrelevant information.
Our goal will be to shift many of these tasks to the edge. This move will maintain a “cleaner” data warehouse and vastly improve the efficiency of data movement.
Session Windowing
A practical example of filtering is "windowing," which involves counting the number of users on a website over a brief period, say 5 minutes. Imagine a website with thousands of daily visitors. You'd want to know the real-time user count. However, website logs are stateless; they're just a series of entries. Going back to the logs we showed before:
55.166.192.39 - christinakim [2024-01-2919:01:09.774077-05:00] GET /search/tag/list HTTP/1.1 200 4951
178.142.230.199 - mary49 [2024-01-29T19:01:12.628377-05:00] GET /Login HTTP/1.1 200 44682
95.187.151.185 - parra [2024-01-29T19:01:13.237689-05:00] GET /apps/cart.jsp?appID=9182 HTTP/1.1 200 4978
31.52.124.51 - karen79 [2024-01-29T19:01:14.456815-05:00] GET /search/tag/List HTTP/1.1 200 5003
94.209.82.75 - anthonyrobert [2024-01-2919:01:17.093817-05:00] GET /explore HTTP/1.1 301 5110
153.93.195.121 - gabrielraymond [2024-01-29T19:01:18.302267-05:00] GET /Login HTTP/1.1 200 85511
47.235.48.10 - jack59 [2024-01-2919:01:20.310266-05:00] GET /w-content HTTP/1.1 200 4922
80.216.236.243
- jamie34 [2024-01-29T19:01:25.057705-05:00] GET /wp-content HTTP/1.1 500 4945
143.134.186.221 - maldodomelissa [2024-01-29T19:01:25.570549-05:00] GET /app/main/posts HTTP/1.1 200 5030
12.70.66.44
- jamesdan [2024-01-29T19:01:25.723001-05:00] GET /apps/cart.jsp?appID=6383 HTTP/1.1 200 5019
122.206.201.74 - masonlauren [2024-01-2919:01:29.582093-05:00] GET /Logout HTTP/1.1 200 36016
201.80.14.219 - camposmegan [2024-01-2919:01:30.611649-05:00] GET /login HTTP/1.1 301 17001
94.209.82.75 - anthonyrobert [2024-01-2919:01:33.093817-05:00] GET /logout HTTP/1.1 500 61851
179.76.136.199 - watso [2024-01-29T19:01:34.973751-05:00] GET /apps/cart.jsp?appID=8060 HTTP/1.1 200 5070
54.233.98.189 - jeff95 [2024-01-2919:01:36.042023-05:00] GET /apps/cart.jsp?appID=2714 HTTP/1.1 200 5027
15.238.79.120 - urussell (2024-01-29T19:01:37.387766-05:00] GET /Login HTTP/1.1 200 78139
55.166.192.39 - chriskim [2024-01-2919:01:37.774077-05:00] GET /posts/posts/explore HTTP/1.1 200 4981
Let’s say you came up with a rule, “A user session spans their first page visit to 5 minutes after their last page visit.” How would you group these together so you could get insights?
Grouping the data can be accomplished in SQL, which offers more power and flexibility than traditional line-by-line log parsers. A query like the one below will get you most of what you need.
create temp table logs as
    from read_csv_auto('bacalhau_log_data.txt', delim=' ')
    select
        column0 as ip,
        -- ignore column1, it's just a hyphen
        column2 as user,
        column3.replace('[','').replace(']','').strptime('%Y-%m-%dT%H:%M:%S.%f%z') as ts,
        column4 as http_type,
        column5 as route,
        column6 as http_spec,
        column7 as http_status,
        column8 as value
;
create temp table time_increments as
    from generate_series(
        date_trunc('hour', current_timestamp) - interval '1 year',
        date_trunc('hour', current_timestamp) + interval '1 year',
        interval '5 minutes'
    ) t(ts)
    select
        ts as start_ts,
        ts + interval '5 minutes' as end_ts,
    where
        ts >= ((select min(ts) from logs) - interval '5 minutes')
        and ts <= ((select max(ts) from logs) + interval '5 minutes')
;
create temp table session_duration_and_count as
    with last_login as (
        from logs
        select
            *,
            max(case when route = '/login' then ts end) over (
                partition by ip, user
                order by ts
                rows between unbounded preceding and current row
            ) as last_login_ts,
    )
    from last_login
    select
        *,
        -- Assuming the first event is always a login
        max(ts) over (partition by ip, user, last_login_ts) as last_txn_ts,
        last_txn_ts - last_login_ts as session_duration,
        sum(case route
            when '/login' then 1
            when '/logout' then -1
            end) over (order by ts) as session_count,
;

from time_increments increments
left join session_duration_and_count sessions
    on increments.start_ts <= sessions.ts
    and increments.end_ts > sessions.ts
select
    start_ts,
    end_ts,
    count(distinct ip) as distinct_ips,
    count(distinct user) as distinct_users,
    count(distinct route) as distinct_routes,
    min(coalesce(session_count, 0)) as min_sessions,
    avg(coalesce(session_count, 0)) as avg_sessions,
    max(coalesce(session_count, 0)) as max_sessions,
group by all
order by
    start_ts
This advanced log parsing query is easy to express thanks to DuckDB's full-featured SQL dialect. We use window functions to compare multiple log lines and inequality joins to aggregate up to a fixed time bucket (every 5 minutes). Regular expressions are also supported for granular parsing tasks, although they were not needed in this example.
That’s most of what you need if you are working on a single machine or against a single data warehouse. But how do you execute this same logic over tens or hundreds of machines at once? The initial answer is to aggregate this into a central data warehouse…but that’s, again, both expensive and time-consuming. This is where MotherDuck, powered by DuckDB, and Bacalhau come in handy.
Building Better Data Pipelines by Processing on the Edge
The starting point for edge computing involves leveraging a platform capable of handling distributed compute jobs. In our example, we're using Bacalhau, which is great for running containers. First, we’ll deploy a Bacalhau agent to each node where we intend to run computations.
With logs being generated, you can execute a job on each node and direct the results precisely where they're needed. A DuckDB job on Bacalhau looks like this:
Job:
  APIVersion: Vlbeta2
  Spec:
    Deal:
      Concurrency: 1
      TargetingMode: true
    EngineSpec:
      Params:
        EnvironmentVariables:
        - INPUTFILE=/var/Log/www/aperitivo_access_logs.log
        Image: docker.io/bacalhauproject/logwindowanalysis:v1.0
        WorkingDirectory: ""
      Type: docker
    Resources:
      GPU: ""
      Memory: 4gb
    Network:
      Type: Full
    Inputs:
      - Name: file:///var/log/www
        SourcePath: /var/log/www
        StorageSource: LocalDirectory
        Path: /var/log/www
      - Name: file:///db/
        SourcePath: /db
        StorageSource: LocalDirectory
        Path: /db
Executing this job only requires one command:
$ cat job.yaml | bacalhau create
That’s it! Now logs are processed wherever a Bacalhau agent is present within your network, using DuckDB. Emergency messages are directed into our event queue for quick response:
And we’ll send our aggregated information to MotherDuck:
Then you can query all the results in your MotherDuck instance!
Based on what we laid out, compared to a centralized log aggregation solution, you stand to save an enormous amount of money. Beyond that, you’ll see faster results and benefit from automatic segmentation of your information based on your requirements!
For Reference: Splunk Cloud Ingestion Prices
Distributed Data Warehouse
We are off to a great start! And if you're looking to run more ad-hoc queries and manage the results with MotherDuck’s serverless analytics platform, that is entirely possible.
Take a look at this job. It’s slightly different from our previous job because we now include a QUERY environment variable which is now included with a generic DuckDB container:
Job:
  APIVersion: Vlbeta2
  Spec:
    Deal:
      Concurrency: 1
      TargetingMode: true
    EngineSpec:
      Params:
        EnvironmentVariables:
        - INPUTFILE=/var/log/logs_to_process/aperitivo_logs.log.1
        - QUERY=SELECT * FROM log_data WHERE message LIKE '%[SECURITY]%' ORDER BY '@timestamp'
        Image: docker.io/bacalhauproject/motherduck-log-processor:1.1.6
        WorkingDirectory: ""
      Type: docker
    Resources:
      GPU: ""
      Memory: 4gb
    Network:
      Type: Full
    Inputs:
      - Name: file:///var/log/logs_to_process
        SourcePath: /var/log/logs_to_process
        StorageSource: LocalDirectory
        Path: /var/log/logs_to_process
      - Name: file:///db/
        SourcePath: /db
        StorageSource: LocalDirectory
        Path: /db
Now, we execute the same command as before:
$ cat job.yaml | bacalhau createAnd just like that, the distributed query runs on every machine, with the results seamlessly integrating into MotherDuck. Isn't that cool?
Conclusion
We explored how to build more efficient data pipelines by processing data at the edge using Bacalhau and MotherDuck to extend DuckDB’s efficient analytical processing engine to the cloud. Regardless of your data volumes or how distributed your system may be, this architecture delivers quicker, smarter outcomes while enhancing security by keeping most of the data stationary.
Learn more about Bacalhau and get started integrating MotherDuck with Bacalhau
Learn more about MotherDuck and get started for free
Learn more about DuckDB and aggregate your DuckDB logs with MotherDuck and Bacalhau


